- Asset Allocation
- Economic Calendar
- Economic Indicators
- Global Market Charts
- Investment Phases
- Investment Quotes
- Investment Reading
- Investment Tips
- Market News
- Warren Buffet
Some of the key economic indicators are listed here.
- Commodities chart
- Baltic Dry Index
- Cash rates available on the Foreign Exchange page - here
- Bond yield curve
- Libor and Euribor (available on the Forex page)
- Money Supply (M2)
- Oil price
- Gold price
- VIX (fear indicator)
- Barron's Confidence Index
- Shiller's P/E level
To see main economic indicators for Australia, check Australian Finance page.
Global strategic outlook and background for economic events can be found at Stratfor.
Commodities Chart
Prices of the best-known commodities: oil, gold, silver, copper.
Baltic Dry Index
Additional Baltic Dry Index charting tool available at the Tools page in Charting Tools section. Article on Wikipedia - here.
Bond Yield Curve
European bond yields - link
U.S. Treasuries, see here

US Statistics
CPI - Consumer Price Index, unemployment, PPI - Producer Price Index...
US data at Bureau of Labor Statistics.
Money Supply (M2)
St. Louis Fed releases the M2 Money Stock supply data. See here.
Oil Price
Brent Crude Oil (LO, IPE) price charts available here. Article on Wikipedia - here.
"The price of Brent North Sea crude is a benchmark for all the types of crude in Europe and that area of the world. Light Sweet Crude, also called West Texas Intermediate Crude (WTIC) is a benchmark for the types of crude oil in North America (like Oklahoma Sweet, Oklahoma Sour, New Mexico Intermediate, Uinta Basin Blac Wax) which is produced in northeastern Utah and other types. The prices are all based on Light Sweet Crude." [source: Yahoo Answers]
Crude Oil daily chart (source: The Market Oracle) and Brent Crude price in the last 12 months (source: MoneyWeek, Financial Times) below.

Fear Index (VIX)
VIX, or Chicago Board Options Exchange Volatility Index shows implied volatility of US S&P 500 index options or, commonly considered as the level of fear in the markets. More information in an article on Wikipedia - here.
VIX chart for the last 12 months:
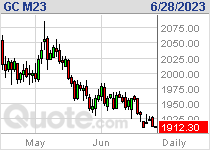
Gold Price
Gold price chart, daily (source: The Market Oracle) and Gold price in the last 12 months (source: MoneyWeek). The price is expressed in US Dollars.
Barron's Confidence Index
Index compares yields of higher grade to lower grade corporate bonds. As yields on lower grade bonds fall, it shows that investors are more confident about the economy. Used for an insight into possible market sentiment about equity securities.
Additional Resources
FulerMoney (link)
Shiller P/E Level (CAPE)
Schiller P/E Ratio for the U.S. available here.
Shiller P/E ratio for MSCI Europe available at MrMarket.
